Rhode Island Employment Trends
Inspired by the chart unveiled by the Governor during last night’s State of the State speech, I went over to the RI Department of Labor and Training’s website last night and downloaded employment figures from 1990 to 2008 (all that was available–I used the “not seasonally adjusted” figures). I was interested in looking at the employment trends of other sectors in addition to manufacturing. So here come the pretty charts! (For all of these, the job numbers are on the “Y” axis and represent thousands of jobs).
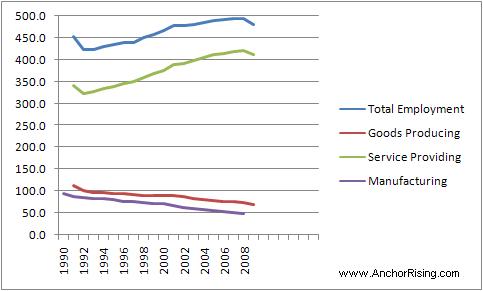
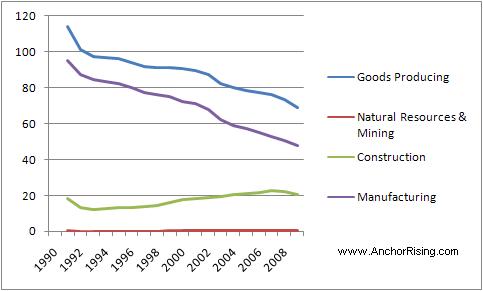
First, here is a chart of the overall jobs broken down by “Goods Producing” and “Service” sector jobs. I included the “Manufacturing” sub-category of “Goods Producing” to show how closely linked the trends are. You can see this even more with the second chart of just the “Goods Producing” sector. It’s also quite obvious that, as we already know, Rhode Island’s is a “Service” economy (just like the rest of the U.S.).
Next, let’s take a closer look at the Service sector. Here’s the big-picture snapshot.
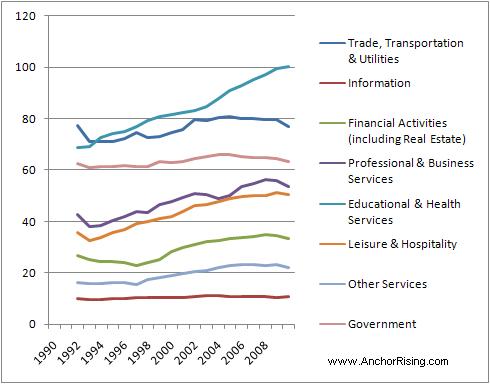
Here we see that the trend is generally upward. The “Information” sector is relatively flat, but the main driver, in terms of overall jobs and rate of growth, is the “Educational and Health Services” sector. The “Leisure and Hospitality” sector is also quite strong and, until recently, so were the “Financial” (driven by Real Estate, I expect) and “Business and Professional Services” categories.
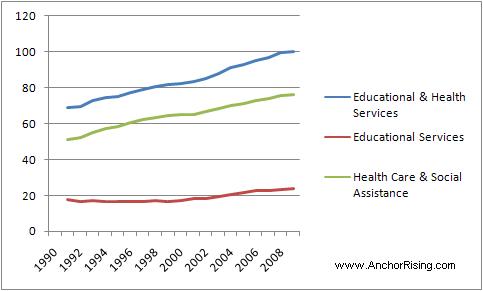
Here is a closer look at the “Educational and Health Services” sector, which makes it obvious that Health Care is a major growth component of our economy.
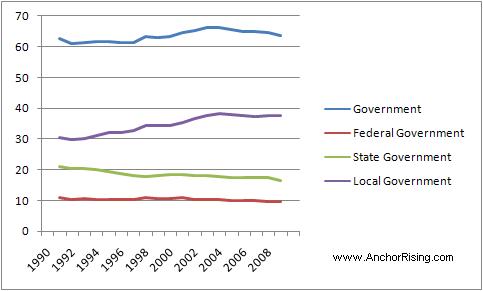
Government is included in the “Service” sector of the economy. The overall chart showed that, after an uptick in 1999, it has remained fairly consistent. However, a closer look supports the Governor’s contention that while Federal and State government employment has been reduced, local government has grown.
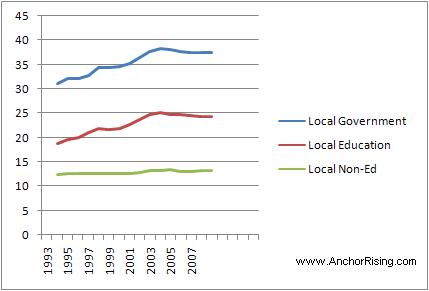
Finally, here is an indication of which component of local government has driven that growth (there was no separate data for educational and non-educational local government employment prior to 1993 and data for 1995 and 1996 was not provided).
Methinks that the home-based welfare daycare establishments are being counted as private sector “businesses” – which I suppose “technically” they are – though they functionally are part of the public sector / poverty industry.
And so really reflect a growth in “state government” employment, not private enterprise (these are the same operations that SEIU tried to unionize as “state employees”).
I recall hearing one of the illegal immigrant advocates claiming on the radio once that Hispanic women-owned businesses are the single greatest area of entrepreneurial / business establishment growth in RI.
I suspected then, and still suspect now, that the speaker was trying to put a positive spin on a negative development, i.e., another taxpayer drain and confirmation of RI’s welfare magnet status.
We could afford all these entitlements if we rebuild our manufacturing industry.
The question is, how?
Right to Work legislation would be a great start.
“Methinks that the home-based welfare daycare establishments are being counted as private sector “businesses”\
HA-you got that right. Don’t forget all the pigs at the trough of the “non-profits”.