The Differences in Barrington
So why did Barrington buck the school-budget-cutting trend? I’d say that there are three factors, the most important of which being the track record of the schools themselves.
As Andrew illustrated yesterday, Barrington’s schools are arguably the best in Rhode Island. Of course, as even the union will argue when it suits its purposes, it’s very difficult to tease those results apart from demographics, but one can make some interesting observations about spending. First of all, the district’s per-student spending on teachers is relatively low; a spreadsheet that I’ve developed over time places the town as 23rd in the state for this measure. Indeed, Barrington’s per student spending on just about everything is relatively low.
One other curiosity is the structure of the town’s steps. For the 2007-2008 school year, the town was seventh from the top in pay for its highest step, but eight from the bottom in average step. Plotting all of the state’s step structures on a line graph (covering the 2008-2009 school year) illustrates why:
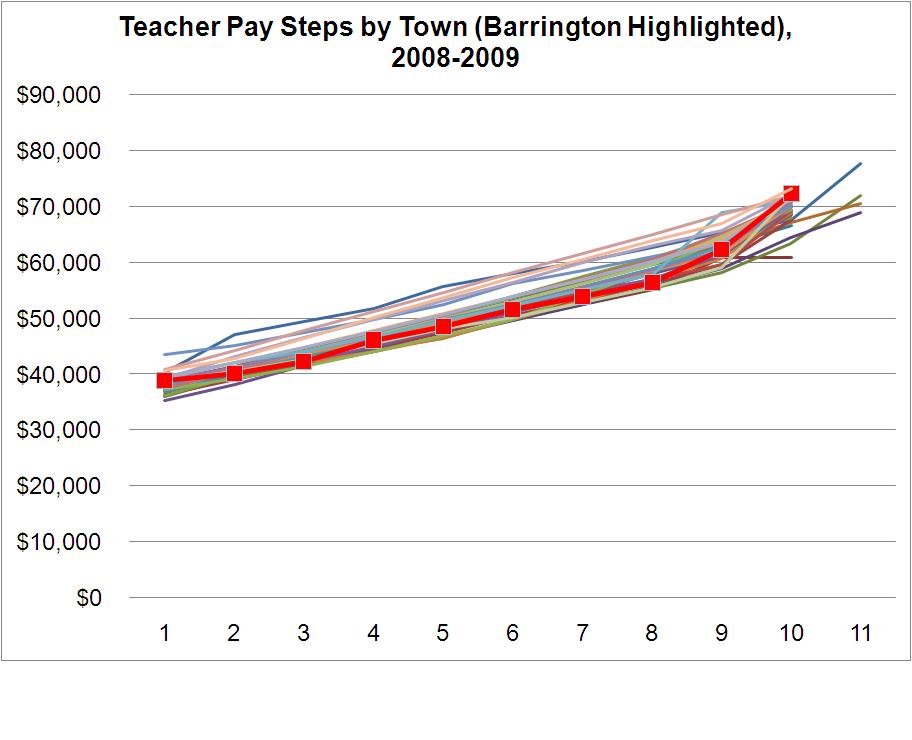
Barrington doesn’t escape the middle and back of the pack, in teacher pay, until the upper steps. The town also has relatively high longevity and higher-degree bonuses. In other words, one could surmise that the Barrington school district strains within the very narrow limits of the union step structure to reward desired behavior. It ain’t a merit system, but it has some related features.
The second factor that I would note as explanation for the results of Barrington’s financial town meeting is probably less consequential, but related. It’s a relatively wealthy suburb, especially compared with some of the more politically heated towns in the news lately.
The third factor — once again related and once again of less significance — is that the taxpayer group formation in Barrington is tied, in its inchoate form, to property revaluations, especially on higher-end homes. The currently active (as opposed to potential) constituency is not as broad as with, say, Tiverton Citizens for Change, which has resulted from a mix of working-class and fixed-income ire, general response to suspicious political games at last year’s financial town meeting, and (yes) property-tax concerns.
It isn’t my intention to offer opinion on the Barrington voters’ action, the other night, or to suggest a direction in which the town should head. Among the things that I love about Rhode Island, however, and among the reasons I’m hesitant to jump on the regionalization bandwagon, is that one really can look around at each municipality as a self-contained segment of the statewide experiment.
Justin:
Your point about the structure of the Barrington teachers’ contract is interesting and perhaps important in considering alternatives, but the care you took in analyzing the date there is matched by your carelessness in glossing over what are surely some of the major causes of disparate outcomes in Barrington and Tiverton.
First, 53% of Barrington adults over 25 have a bachelor’s degree or more education as compared to just 24% in Tiverton. Barrington and East Greenwich are the highest in the state on this measure. Second, per capita income: Barrington — $35,881; Tiverton – $22,866. East Greenwich . . . . drum roll — $38,593.
Play fair Justin.
Is teacher pay a factor in good schools. I am not really sure what you are saying about this. I may be a bit slow but just a question
You misconstrue my intent, Community, which continued from my opening question:
In that context, the largest point is that residents of a town will have less inclination to make dramatic cuts to school budgets when those schools are the highest performing in the state and spend less per pupil for those results and even more especially when teachers’ pay seems structured with some sense of long-term commitment (mostly as a stand-in for merit).
My point was not to claim a link between Barrington students’ success and the relative pay of the teachers. Of course, that’s a direction in which research and discussion could head; indeed, I’d be very interested in evidence either way, because I’ve yet to see any. But when you only get a half-hour break from swinging a hammer during which to eat lunch and create blog posts, there’s only so much ground you can cover.
Bones,
I’ve yet to see any evidence that teacher pay correlates with (much less causes) student achievement.
What I see here is further evidence that educational success is directly related to socio-economic conditions in a community. Directly as a result of this, no amount of money will ever change the stripes on this tiger.
Barrington and East Greenwich will always be at the top in achievement and CF, Woonsocket, Providence, West Warwick, etc. will always be near the bottom.
So let’s move on to a school system that is student oriented and directs resources where they can do the most good.
It seems to me that blaming the teacher for the poor performance which is most caused by undereducated parent(s) is misdirected rage. So, how much is the right pay for a teacher? Just wondering.
What this shows is that once again, Justin is caught in his rhetoric. You just can’t pay teachers too little for him.
for one third of their careers, teachers are paid below the “market rate”. Steps save districts money. Pay everyone the market rate, at step 10 and you would solve this problem.
Justin doesn’t want to tell you that……I wonder why?
Another point about Barrington schools is that you have a lot of parents who can read the Infoworks report data, the most important of which are the school Value Added scores. These compare actual results to those predicted solely on the basis of the demographics of a given school’s students. Barrington teachers regularly deliver positive value added scores.
Another interesting comparison is between senior step teachers in Barrington and those in other systems. You find few if any hard core union types in this group, which is a contrast to other systems. Weak teachers who try to hide behind the union tend not to last too long in the Barrington schools, where peer pressure — call it a professional dedication to excellence — forces them out.
In general, senior teachers in Barrington schools tend to act like professionals, and the town’s residents return that respect when it comes to budget and the way they interact.
Unfortunately, this is yet another example of Crowley and the NEA/AFT crew not being able to handle the truth.
Another observation.
Scroll down to Morse’s entry on “RI Educational Data, Courtesy of the Town of Barrington” and you will see that on the Per Pupil spending chart, Barrington falls right between Woonsocket and Pawtucket. The only difference of possible consequence is that Barrington is an NEA district while the two cities are AFT. I say that because there are stark differences in the contracts between these two unions.
So now that we have determined that Woonsocket ($12,076) and Pawtucket ($11,947) are spending the right amount of money (because they spend the same as Barrington ($12,023)), what is the difference in the skills and performance of the teachers that accounts for the difference in performance?
Or is it that the lack of parental skills and education pushes parenting obligations onto the school system (teachers) and takes valuable time and resource away from the staff when they try to devote their time to education.
Please…someone tell me how a school system fixes that problem without spending any money on social services and other educational support services that the family won’t provide?
Please, I live in Woonsocket and I want to know how we begin to perform this miracle. Or do I just move to Barrington?
To: John#1 from John #2:
The key issue is the value added by teachers in Woonsocket compared to the value added by teachers in Barrington, relative to the demographics of their respective student populations. That is all for which you can realistically hold the teachers responsible.
Whether you can use the power of the state to convert Woonsocket demographics into Barrington demographics — e.g., by taxing the latter and redistributing income to the former — is an entirely different kettle of fish (and gets you into other issues like assortative mating and different cultural norms, which leads me to believe that income redistribution alone will not succeed). But I digress.
The brutal reality is that, based on the Infoworks methodology, your teachers in Woonsocket don’t add as much value — in fact, some of their value added scores are actually negative — than the teachers in Barrington.
So rather than attacking Barrington, or crying out for more social spending, I’d say you might be better advised to start looking closer to home for answers about how to improve your children’s public school education (which, of course, also has knock-on effects for RI’s ability to attract private sector employers, generate tax revenue, and provide our best in the nation social safety net programs that attract so many people to our fair state — including Woonsocket).
“The brutal reality is that…your teachers in Woonsocket don’t add as much value — in fact, some of their value added scores are actually negative — than the teachers in Barrington.”
So what you are saying is that Woonsocket’s teachers suck while Barrington’s teachers are simply better at what they do. Somehow I doubt that a teacher, relocated from Woonsocket to Barrington would diminish the quality of education in Barrington, nor do I think that the reverse would hold true. A Barrington teacher coming to teach in Woonsocket would not necessarily be better able to educate once put up against the urban obstacles.
What you need to admit is that you believe that the ignorant should be left to their own devises and, failing to get a first rate education, well tough shit. Maybe we in Woonsocket would do better just spending our money to pay rent for these folks in Barrington. Then we could celebrate their inevitable success.
Yeah…that’s the ticket.
>for one third of their careers, teachers are paid below the “market rate”. Steps save districts money. Pay everyone the market rate, at step 10 and you would solve this problem.
Hah hah hah.
As Bugs Bunny used to say, “what a maroon!”
1. By definition, there is no “market rate” in the public sector.
2. To the extent that there is a market rate for teachers, it is in private schools. Considerably lower than the union-monopoly rates of public schools, and delivering higher quality to boot.
3. Virtually everyone makes less money in the first third of their careers, as they learn the ropes, get promotions, etc. We know that Crowley and his ilk view teachers as fungible, interchangeable units in their collective, but geez, get real.
4. Studies have shown that once accounting for the part-time nature of their jobs, the golden benefit packages and cushy, cushy pensions, public sector teachers are highly highly compensated, and grossly compensated when one factors in their low performance.
John #1: John, let me explain again. The Infoworks Value Added methodology (which is used in many other places around the world) starts with a prediction of what a given group of student will achieve on a standardized test on the basis of their demographics — e.g., how many from single parent homes, how many ESL, how many with IEPs, average years of parental education, average family income, etc. If the actual test results are above that, the teachers are said to have added value. If the actual test results are below the predicted results, the teachers are said to have destroyed value. That says nothing about whether you organize differently to teach children in Woonsocket than you do in Barrington. To use an analogy, someone who coaches high school or college women’s soccer and someone who coaches the equivalent men’s team will tell you they use different approaches, given the different demographic inputs they have to work with. What the value added scores do tell you is that for some reason(s), the Barrington teachers have demonstrated a superior ability to add value to the students that come into their schools each day. Let me reiterate: this is not about differences in demographics between Woonsocket and Barrington. This is about the value the respective teams of teachers add to their students’ educations AFTER taking the demographic differences into account. Hence my comment, that when it comes to improving education in Woonsocket, you might want to start looking at the way the schools and teachers, and not the automatically blame everything on demographics and demand more money from the taxpayers to fix the problem. Here’s another hint: you have a real hard core teachers union in Woonsocket. Hence, it you took a team of Woonsocket teachers, with all their current practices,… Read more »
To John #2 from John #1
First, I’m not sure I completely agree with your interpretation of the Infoworks analysis, but that would be far too complicated a discussion to be meaningful.
Second, I think I need to furthere study the correlation between results by district and union affiliation because you seem to express a concern I mentioned in my first comment regarding teh different union status.
Third, I’m going to be sure to suggest to our school committee that we offer to pay reimburse special families for their rent ion Barrington in order to improve the likelihood of academic success for their children.