Trends of the Decade
Three critical considerations tend to get lost in debates about population and the ways in which it flows and changes over time. The first is that large trends trump. A tax break isn’t going to prevent a global economic hurricane from rearing its head in one state while devastating the next one over; there will surely be differences in how the states weather the storm, but the storm will appear in statistical results for both.
The second is the complexity of the numbers. As the income brackets shift within a state, the reasons for each individual change will span so many categories of information that a thorough picture becomes impossible to paint. Marriage rates, tax policy, welfare policy, different markets, employment, and on and on will affect the results. When multiple states are on the table, the number of policies and trends is that much greater. As far as I know, nobody has undertaken a study to break regional changes down to the percentage effect of every demographic shift, and even then assumptions would have to be made which individuals move to which categories.
The third factor that tends to get lost is that the effects of public policies don’t just splash into the society on the day that they are signed into law. The debate leading up to passage of a law will affect people’s behavior, as will the perceived likelihood that a particular policy will survive the political winds. Taxpayers (to limit the field) will respond to changes in the law, but they’ll also respond to a general sense of a state’s direction. Meanwhile, laws can either betoken additional reforms in the same direction, or they can make it to the governor’s desk with the impression of having barely little chance of resisting repeal or efforts to undermine them.
In any event, what those with a specific interest in the health of a particular state must do is to assess the condition of the state and determine what effect policies have had, or will have, from the baseline of what would happen in their absence. If the widget industry is in decline, tax breaks for widget manufacturers will preserve their jobs to some extent, even if they cannot prevent the trendline from drifting down.
Such are the thoughts that came to mind upon viewing the following set of charts, which will probably take me multiple days to roll out, and which update previous posts here, here, and here.
<$50,000
 – $50,000-74,000
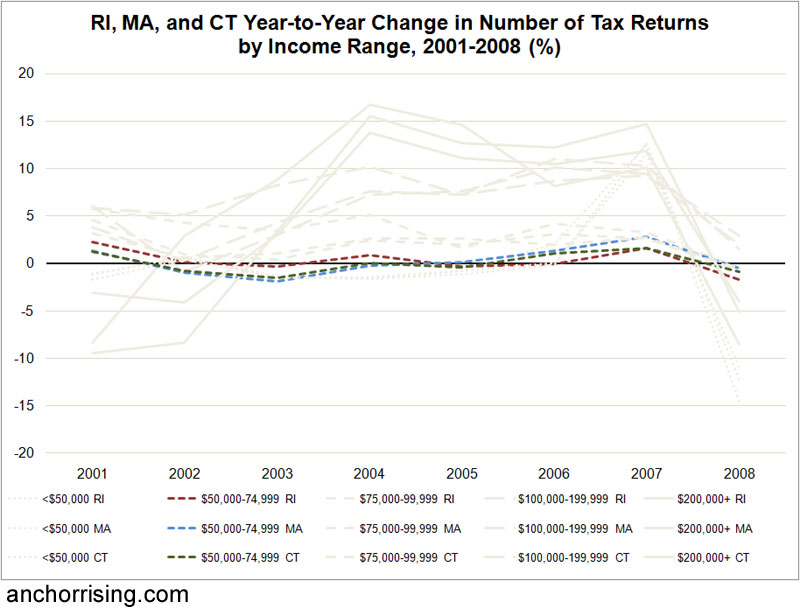 – $75,000-99,999
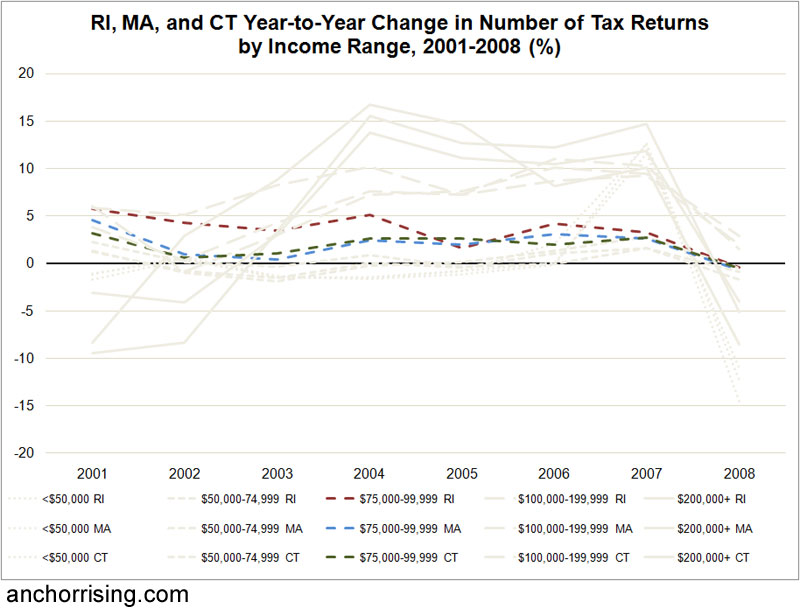 – $100,000-199,999
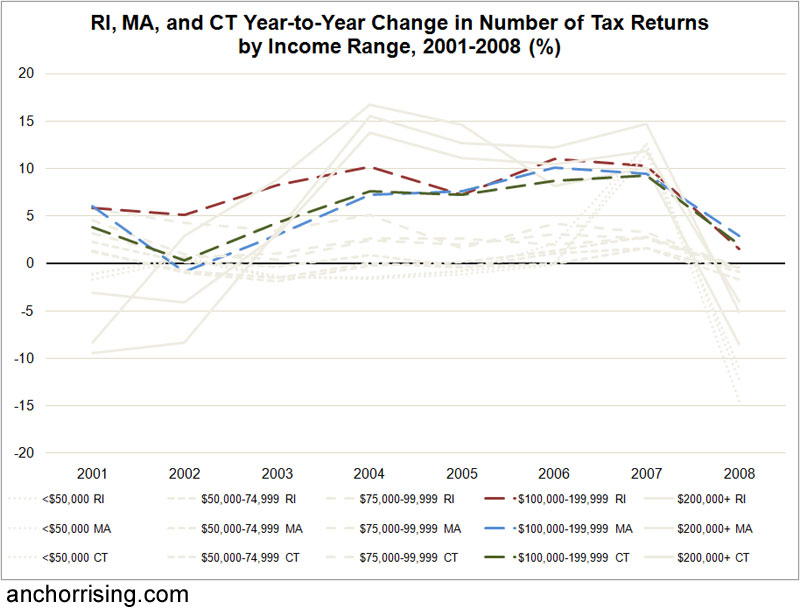 – $200,000+
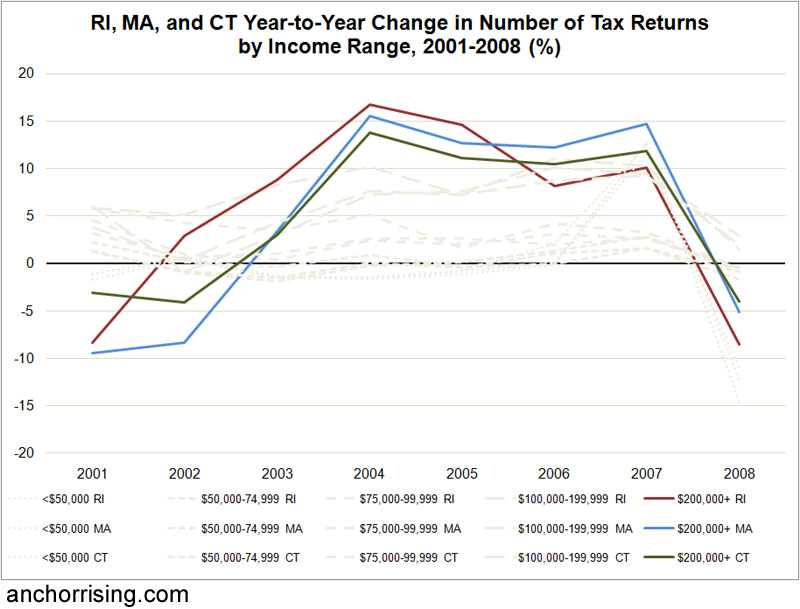
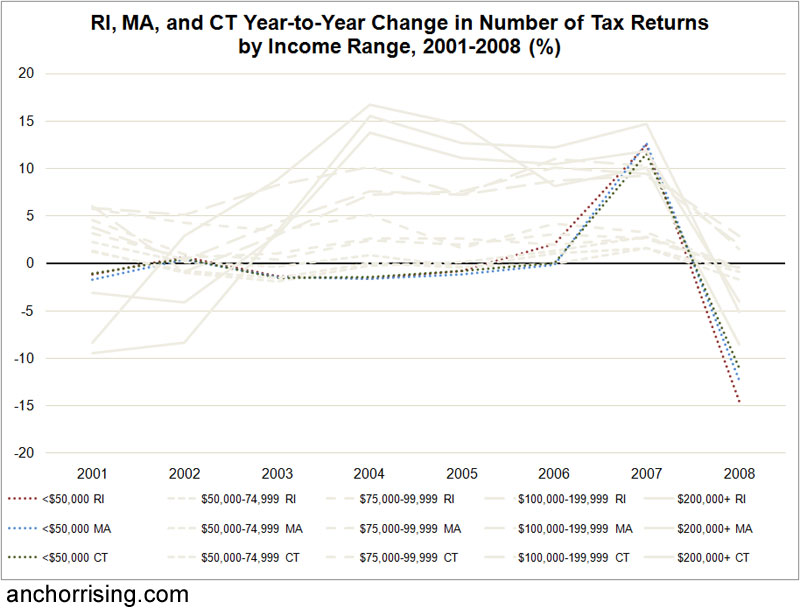
(Click and hold an tax bracket to highlight its corresponding lines.)
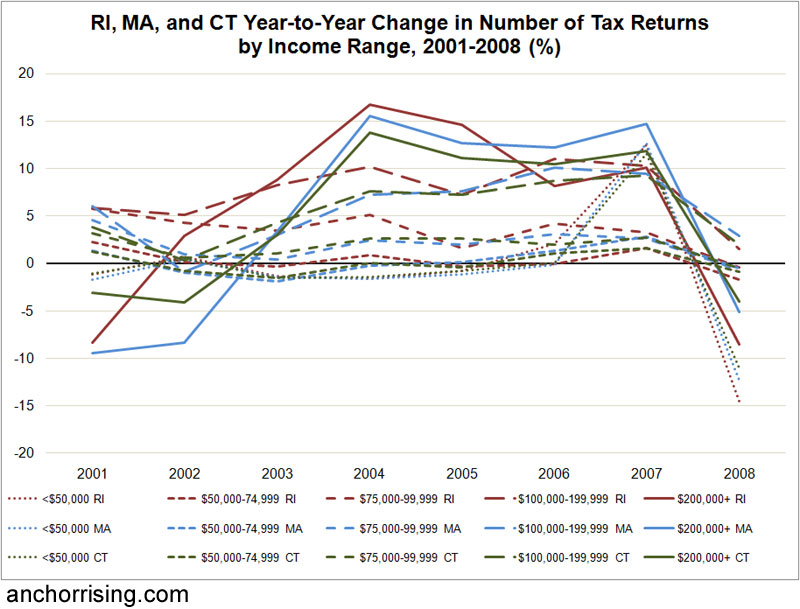
Each data point in this chart (based on this data) represents the percentage change in the number of IRS tax returns claiming an income range from the previous year. Thus, in 2004, the number of tax returns showing $200,000 or more in adjusted gross income increased by 16.7% from 2003; from 2004 to 2005, the change was 14.6% — still a large increase, but because the rate of change slowed, the graph shifts down. The red lines show tax returns filed from Rhode Island, blue from Massachusetts, and green from Connecticut. The smaller the dash marks of a line, the lower the income bracket.
Because the highest bracket is the most controversial, because it is most affected by Rhode Island’s constantly churning tax policy of the last decade, and because it results in about 40% of all income taxes to the state, the solid lines are of greatest interest. And as is clear, all three states began the decade with losses of such taxpayers (likely because of both migration away from the region and a loss of wealth associated with the dot-com bust). In 2002, the year that Rhode Island began to phase its capital gains tax toward zero percent, we were the first of the three states to show an increase in wealthy households, and we led the three states until 2005.
At that point, our state was in the midst of a series of budget-deficit years to which our elected officials responded with one one-time fix after another. The General Assembly enacted the flat tax phase-out in 2006, but whereas the capital gains change promised to make investments made in and from Rhode Island more valuable (because less taxed) over time, the flat tax phased out gradually and required calculation against the benefits of itemizing and capital gains income. In 2006, the flat tax offered an 8% rate (as opposed to the regular 9.9%) and decreased 0.5% each year.
In any event, as the final years of the decade wore on and brought economic crisis, it became increasingly clear that lawmakers would backtrack on tax reform, and by 2008 Rhode Island led the region in loss of wealthy taxpayers. The capital gains tax phaseout disappeared in 2009, and the flat-tax alternative was frozen by the larger income tax overhaul last year.
An alternative narrative would be that Rhode Island recovered more quickly from the dot-com bust at the beginning of the decade because it had benefited less from the corresponding boom. Then, with so much waterfront property, the state experienced the ups and downs of the real estate bubble more profoundly than its neighboring states.
As this post began by noting, this type of data is subject to interpretation, and given data related to taxpayer migration as well as trends indicated by tax returns and Census data, I’d argue that my long-running explanation still stands: Favorable changes in income tax policy have helped Rhode Island to maintain and grow its base of wealthy residents. Unfortunately, though, heavy regulations, mandates, and taxes overall have not allowed the economy to capitalize on that available economic spark. The “productive class” — my term for the upwardly mobile upper-working to lower-middle class range — has not effectively acted as the kindling to turn that available money into economic growth.
Thus, Rhode Island has been more vulnerable to the mobility of the wealthiest Americans and has not fostered an environment of long-term advancement for the motivated workers and entrepreneurs who will willingly add hours of labor to the economy. Inasmuch as my own quest for upward mobility has not yet borne the fruit that would allow me to continue with this topic, today, I’ll have to take up the specifics of taxpayer migration data tomorrow morning.
(The next post in this series is here.)
Awesome analysis, Justin.