The State of Education in Rhode Island, Part 5
The same method that was applied to the changes between 8th an 11th grade NECAP results, to try to get a measure of the performance of Rhode Island’s high-school systems taking into account the initial proficiency-level of the students, can also be applied to changes occurring between other grades.
The chart below is a 2D-index based on how well districts did in improving NECAP scores between the 5th and the 8th-grades…
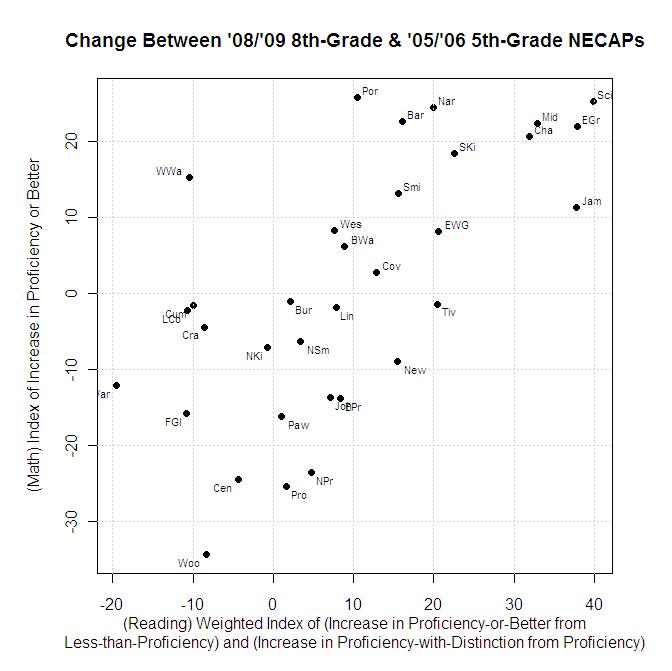
Schools nearer the upper right-hand corner did well in both reading and math. Schools nearer the lower left-hand corner have showed declines in both areas. The charts below the fold present the underlying information on…
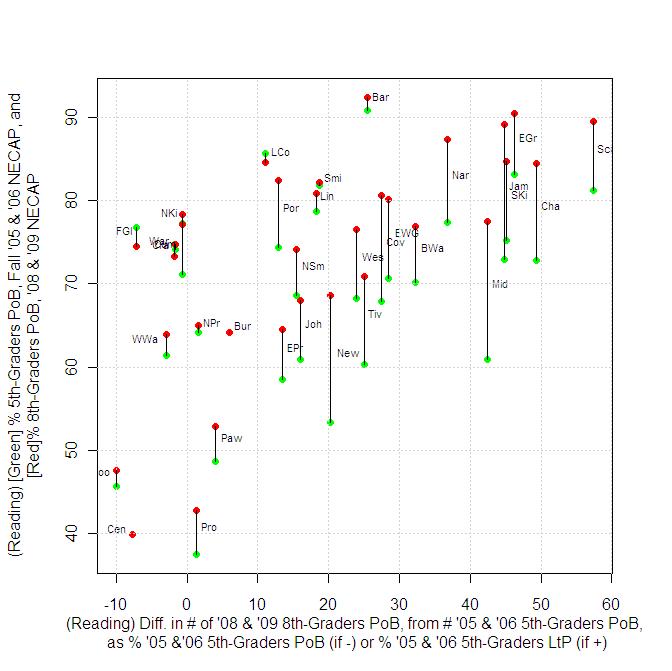
- Improvements in students Proficient at Reading.
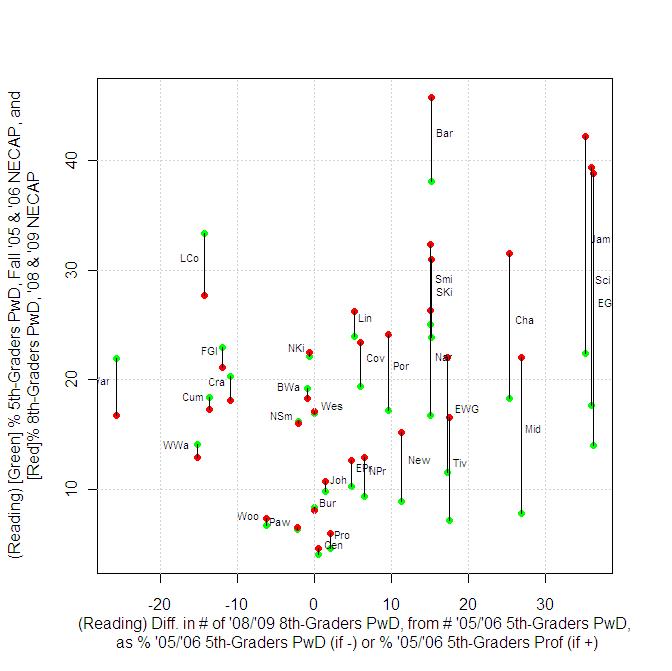
- Improvements in students Proficient with Distinction at Reading.
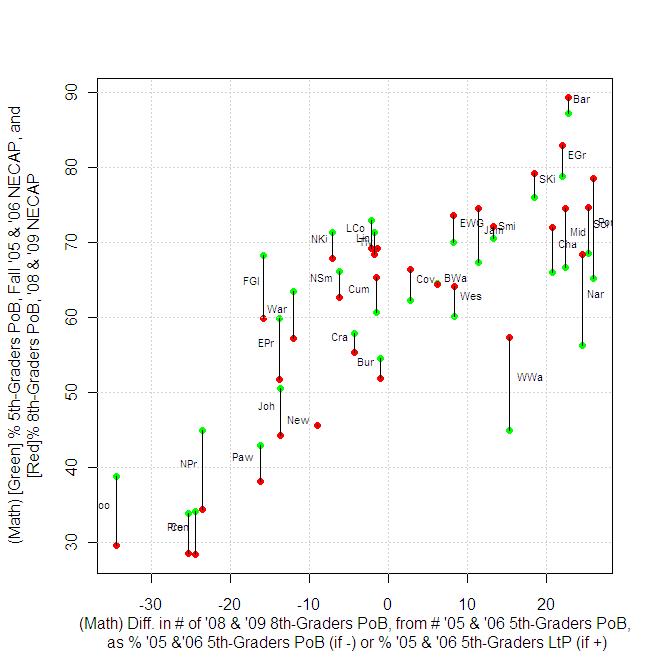
- Improvements in students Proficient at Mathematics.
Two differences from the 8th-grade to 11th-grade results are immediately worth noting…
- Between the 5th and 8th-grades, some districts did succeed in improving their number of students proficient in mathematics, unlike between the 8th and 11th-grades, where every district showed a decline. (For this reason, change in students proficient or better, rather than partially proficient or better, is used as the mathematics index.)
- Reiterating once again that the results here are far from dispositive, it should be noted that there is a much stronger correlation here than at the high school level, between districts starting from low proficiency rates and the largest declines in proficiency. This suggests that students in Rhode Island’s underperforming districts may be falling furthest behind somewhere before high school begins. Exploring this result further will require matching test results to the movement of students in and out of a district, between the starting and ending years of a measured test period.
| Community | # of ’08/’09 8th-Graders, PoB at Reading | # of ’05/’06 5th-Graders, PoB at Reading | Change in # PoB at Reading, between 5th and 8th Grades | # of ’05/’06 5th-Graders, LtP at Reading | Change in # PoB at Reading, between 5th and 8th Grades, as % of ’05/’06 5th-Graders LtP |
| Scituate | 266 | 235 | 31 | 54 | 57.4% |
| Chariho | 475 | 401 | 74 | 150 | 49.3% |
| East Greenwich | 352 | 322 | 30 | 65 | 46.2% |
| South Kingstown | 464 | 404 | 60 | 133 | 45.1% |
| Jamestown | 91 | 78 | 13 | 29 | 44.8% |
| Middletown | 289 | 227 | 62 | 146 | 42.5% |
| Narragansett | 216 | 195 | 21 | 57 | 36.8% |
| Bristol-Warren | 399 | 351 | 48 | 149 | 32.2% |
| Exeter-West Greenwich | 255 | 228 | 27 | 95 | 28.4% |
| Coventry | 662 | 586 | 76 | 277 | 27.4% |
| Barrington | 479 | 467 | 12 | 47 | 25.5% |
| Tiverton | 219 | 188 | 31 | 124 | 25.0% |
| Westerly | 390 | 351 | 39 | 163 | 23.9% |
| Newport | 212 | 180 | 32 | 158 | 20.3% |
| Smithfield | 351 | 337 | 14 | 75 | 18.7% |
| Lincoln | 445 | 424 | 21 | 115 | 18.3% |
| Johnston | 376 | 341 | 35 | 219 | 16.0% |
| North Smithfield | 213 | 199 | 14 | 91 | 15.4% |
| East Providence | 526 | 480 | 46 | 341 | 13.5% |
| Portsmouth | 353 | 338 | 15 | 116 | 12.9% |
| Little Compton | 55 | 54 | 1 | 9 | 11.1% |
| Burillville | 217 | 210 | 7 | 117 | 6.0% |
| Pawtucket | 718 | 689 | 29 | 730 | 4.0% |
| North Providence | 328 | 325 | 3 | 182 | 1.6% |
| Providence | 1368 | 1338 | 30 | 2240 | 1.3% |
| Community | # of ’08/’09 8th-Graders, PoB at Reading | # of ’05/’06 5th-Graders, PoB at Reading | Change in # PoB at Reading, between 5th and 8th Grades | # of ’05/’06 5th-Graders, LtP at Reading | Change in # PoB at Reading, between 5th and 8th Grades, as % of ’05/’06 5th-Graders PoB |
| Cumberland | 587 | 591 | -4 | 240 | -0.7% |
| North Kingstown | 530 | 534 | -4 | 157 | -0.7% |
| Warwick | 1270 | 1290 | -20 | 449 | -1.6% |
| Cranston | 1230 | 1252 | -22 | 423 | -1.8% |
| West Warwick | 333 | 343 | -10 | 216 | -2.9% |
| Foster-Glocester | 286 | 308 | -22 | 93 | -7.1% |
| Central Falls | 192 | 208 | -16 | 315 | -7.7% |
| Woonsocket | 390 | 433 | -43 | 517 | -9.9% |
| Community | # of ’08/’09 8th-Graders, PoB at Math | # of ’05/’06 5th-Graders, PoB at Math | Change in # PoB at Math, between 5th and 8th Grades | # of ’05/’06 5th-Graders, LtP at Math | Change in # PoB at Math, between 5th and 8th Grades, as % of ’05/’06 5th-Graders LtP |
| Portsmouth | 337 | 296 | 41 | 158 | 25.9% |
| Scituate | 222 | 199 | 23 | 91 | 25.3% |
| Narragansett | 169 | 142 | 27 | 110 | 24.5% |
| Barrington | 463 | 448 | 15 | 66 | 22.7% |
| Middletown | 278 | 250 | 28 | 125 | 22.4% |
| East Greenwich | 323 | 305 | 18 | 82 | 22.0% |
| Chariho | 404 | 365 | 39 | 188 | 20.7% |
| South Kingstown | 435 | 411 | 24 | 130 | 18.5% |
| West Warwick | 299 | 252 | 47 | 308 | 15.3% |
| Smithfield | 307 | 291 | 16 | 121 | 13.2% |
| Jamestown | 76 | 72 | 4 | 35 | 11.4% |
| Westerly | 327 | 310 | 17 | 206 | 8.3% |
| Exeter-West Greenwich | 234 | 226 | 8 | 97 | 8.2% |
| Bristol-Warren | 334 | 323 | 11 | 177 | 6.2% |
| Coventry | 545 | 536 | 9 | 324 | 2.8% |
| Community | # of ’08/’09 8th-Graders, PoB at Math | # of ’05/’06 5th-Graders, PoB at Math | Change in # PoB at Math, between 5th and 8th Grades | # of ’05/’06 5th-Graders, LtP at Math | Change in # PoB at Math, between 5th and 8th Grades, as % of ’05/’06 5th-Graders PoB |
| Burillville | 176 | 178 | -2 | 148 | -1.1% |
| Tiverton | 213 | 216 | -3 | 96 | -1.4% |
| Cumberland | 498 | 506 | -8 | 327 | -1.6% |
| Lincoln | 376 | 383 | -7 | 154 | -1.8% |
| Little Compton | 45 | 46 | -1 | 17 | -2.2% |
| Cranston | 931 | 974 | -43 | 708 | -4.4% |
| North Smithfield | 180 | 192 | -12 | 98 | -6.3% |
| North Kingstown | 458 | 493 | -35 | 198 | -7.1% |
| Newport | 141 | 155 | -14 | 185 | -9.0% |
| Warwick | 972 | 1106 | -134 | 637 | -12.1% |
| Johnston | 245 | 284 | -39 | 277 | -13.7% |
| East Providence | 425 | 493 | -68 | 330 | -13.8% |
| Foster-Glocester | 230 | 273 | -43 | 127 | -15.8% |
| Pawtucket | 519 | 619 | -100 | 820 | -16.2% |
| North Providence | 175 | 229 | -54 | 281 | -23.6% |
| Central Falls | 139 | 184 | -45 | 355 | -24.5% |
| Providence | 922 | 1236 | -314 | 2412 | -25.4% |
| Woonsocket | 244 | 372 | -128 | 587 | -34.4% |
| Community | # of ’08/’09 8th-Graders, PwD at Reading | # of ’05/’06 5th-Graders, PwD at Reading | Change in # PwD at Reading, between 5th and 8th Grades | # of ’05/’06 5th-Graders, Prof. at Reading | Change in # PoB at Reading, between 5th and 8th Grades, as % of ’05/’06 5th-Graders LtP |
| East Greenwich | 151 | 54 | 97 | 268 | 36.2% |
| Scituate | 117 | 51 | 66 | 184 | 35.9% |
| Jamestown | 43 | 24 | 19 | 54 | 35.2% |
| Middletown | 82 | 29 | 53 | 198 | 26.8% |
| Chariho | 177 | 101 | 76 | 300 | 25.3% |
| Tiverton | 51 | 22 | 29 | 166 | 17.5% |
| Exeter-West Greenwich | 70 | 37 | 33 | 191 | 17.3% |
| South Kingstown | 170 | 128 | 42 | 276 | 15.2% |
| Barrington | 237 | 196 | 41 | 271 | 15.1% |
| Narragansett | 65 | 42 | 23 | 153 | 15.0% |
| Smithfield | 138 | 103 | 35 | 234 | 15.0% |
| Newport | 47 | 30 | 17 | 150 | 11.3% |
| Portsmouth | 103 | 78 | 25 | 260 | 9.6% |
| North Providence | 65 | 47 | 18 | 278 | 6.5% |
| Coventry | 192 | 167 | 25 | 419 | 6.0% |
| Lincoln | 144 | 129 | 15 | 295 | 5.1% |
| East Providence | 103 | 84 | 19 | 396 | 4.8% |
| Providence | 188 | 164 | 24 | 1174 | 2.0% |
| Johnston | 59 | 55 | 4 | 286 | 1.4% |
| Central Falls | 22 | 21 | 1 | 187 | 0.5% |
| Burillville | 27 | 27 | 0 | 183 | 0.0% |
| Westerly | 87 | 87 | 0 | 264 | 0.0% |
| Community | # of ’08/’09 8th-Graders, PwD at Reading | # of ’05/’06 5th-Graders, PwD at Reading | Change in # PwD at Reading, between 5th and 8th Grades | # of ’05/’06 5th-Graders, Prof. at Reading | Change in # PoB at Reading, between 5th and 8th Grades, as % of ’05/’06 5th-Graders Prof. |
| North Kingstown | 152 | 153 | -1 | 381 | -0.7% |
| Bristol-Warren | 95 | 96 | -1 | 255 | -1.0% |
| North Smithfield | 46 | 47 | -1 | 152 | -2.1% |
| Pawtucket | 88 | 90 | -2 | 599 | -2.2% |
| Woonsocket | 60 | 64 | -4 | 369 | -6.3% |
| Cranston | 303 | 340 | -37 | 912 | -10.9% |
| Foster-Glocester | 81 | 92 | -11 | 216 | -12.0% |
| Cumberland | 132 | 153 | -21 | 438 | -13.7% |
| Little Compton | 18 | 21 | -3 | 33 | -14.3% |
| West Warwick | 67 | 79 | -12 | 264 | -15.2% |
| Warwick | 283 | 381 | -98 | 909 | -25.7% |
Andrew, There is a factor that you must consider when rendering an opinion on test scores……the change in attitude between the 8th and 11th grade. Younger students tend to want to try their best on these test just to please their parents and teachers. 11th graders, not quite the same! They are at a point where they tend to think independently, they want immediate gratification, and really do not see any point, or anything to gain, from these test and as a result many do not try. The state test does not affect their grade; it does not affect their status with the schools they are applying to, so why should they try? Plus, they are now entering adult life and they have grades, sports extra curricular activities, part time jobs and most important of all, their social life. These tests are viewed, by many HS students as an unnecessary nonsense. I work with high school students and they dread the state testing. Many of them, because I am approachable, will tell me they do not care one bit how they do on NECAP and they are not going to waste hours of their time on something that is useless, from their perspective. If they bomb it, they are allowed alternative pathways to prove proficiency, graduate, and they know it. Now, factor in the lives, that some of our urban students live. Some our out on the street corner until 2 am because their own parents, who have “activities” going on, won’t let them in the house. Others, like one young man I had in my summer program, was involved in a dispute that included gang members had trouble concentrating because he had been shot at the night before. People say, “the urban line is just an excuse” but they… Read more »
Ed,
One main problem with what you are arguing is that, in least in terms of total numbers, the high schools seem to be doing better than the junior highs (and the end of middle school). Woonsocket was +112 students proficient in reading between grades 8 and 11, but -43 students proficient between grades 5 and 8. Providence was +634 8-to-11, but only +30 5-to-8. Central Falls was +40 8-to-11, but -16 5-to-8.
It could be, I suppose that “student mobility” is somehow impacting younger students more seriously than older ones. Or maybe there are many students that come from private K-8 systems into public high schools (but then why do the numbers in mathematics all fall off so badly?). But it could also be possible that the real crash in our educational system is happening somewhere before high school, and the high-schools are starting to pick up the pieces.