If You Want No More Games, Take Away the Ball
New Hampshire employs more public employees per citizen than Rhode Island does — so explained the Rhode Island NEA’s Bob Walsh in a comment to this post:
Mike – Well, I am not a Marxist (unless Groucho counts) but I assume you know by now that the “New Hampshire” miracle is really the New Hampshire mirage. NH, in fact, has 24,700 state employees in total (source: Governing Magazine, which lists RI at 17,500). More importantly, NH has 188 state government employees per 10,000 population (31st nationally) versus RI at 164 per 10,000 population (40th nationally).
Although I noticed that Mr. Walsh didn’t address the fact that led commenter Mike to introduce New Hampshire into the discussion in the first place — that the larger state runs on significantly less public money — I’m always intrigued by arguments that Rhode Island isn’t floating somewhere near the bottom of the pool and poked around for Bob’s source. And sure enough, not only does New Hampshire have more state and local employees per 10,000 population (188 and 475, respectively) than Rhode Island (164 and 353), but Connecticut (196 and 463) and Massachusetts (187 and 425) do, as well. Of course, it bears mentioning that only Connecticut pays its public workers more and that Rhode Island’s median household is significantly poorer:

As you can see, Rhode Island is the only one of the four states with an average public employee salary that is higher than the median household income. (The two data points aren’t comparable to each other for a variety of reasons, though. For one thing, the salary numbers are averages, which is arguably more appropriate when discerning how much the average worker costs the state, while the income numbers are medians, which gives a better impression of the general wealth of the state’s citizens by diminishing the effect of outliers. This consideration is probably far outweighed, however, by the fact that the income is for households, while the salaries are for individuals and often represent only a portion of a “public employee household.”)
The information in the above figure ties in curiously with something that Walsh goes on to say:
We also have a higher cost of living, and our public sector compensation is generally in line with MA and below CT (which is our market).
The interesting — all too typical, from a public union guy — point is that Rhode Island, despite being poorer, has both a higher cost of living and union compensation packages to match the wealthier states. No wonder we feel so strained!
Now add pensions into the analysis. When it comes to public employees’ contributions to their own pension systems (according to Bob’s source), Rhode Island ties Massachusetts for the lowest percentage (13.4%, versus CT’s 16.2% and NH’s 22.3%). Not surprisingly, when it comes to the highest contributions from the public, Rhode Island (23.2%) is only outdone by Connecticut (31.5%) — a state with notably low returns on pension-related investments.
Here enters a counterintuitive finding that illustrates just how sunken Rhode Island is:
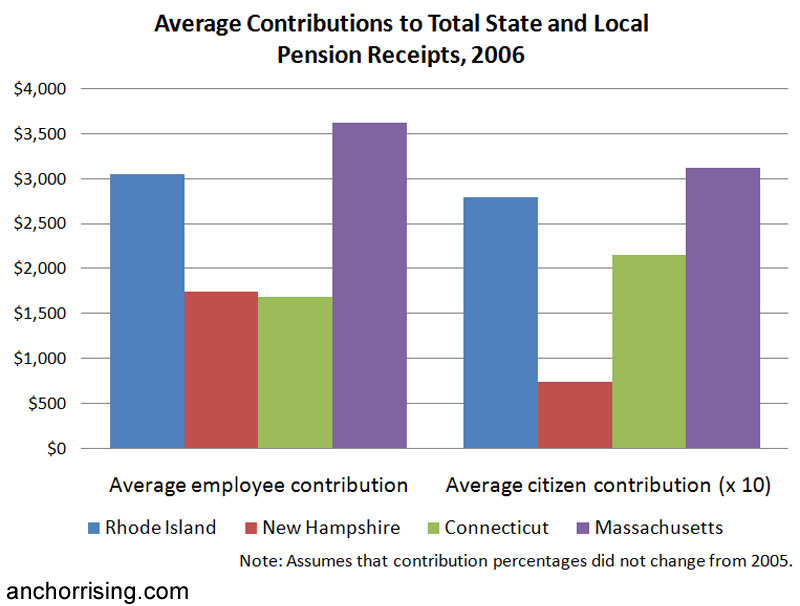
Somehow, Rhode Island manages to charge public employees a lower percentage of their pension plans, while still charging them more actual dollars than all states but Massachusetts — at the same time that it’s charging its citizens a comparably high dollar amount. One possible reason for this result is that Rhode Island’s pension offerings are just too generous. Walsh prefers a different spin:
This is an extremely important point regarding pensions – teachers already contribute 9.5% of salary towards their own pensions, and while the combined management contribution (state and local) is listed as over 22% of salary in the coming year, the vast majority of that contribution is related to the existing unfunded liability, and the sustaining contribution needed to actually support the pension for the individual teacher is less than 4%. So, if you did manage to stop the pension system on a going forward basis, the vast majority of the contributions would still need to be made in addition to a match for a 401-k type system. We need to stay on the path toward full funding of the system, without any more game playing, and when full funding is realized, the state and local contribution needed will be under 4% combined.
Check with the pension board, do your own math, consult with the experts, etc. – these are the actual mathematical facts – keeping the pension systme intact is cheaper, and it provides a better benefit in almost all respects.
(Explained another way – every time the pension system was underfunded in one way or another – early retirements, banking crisis, marked to market, less than market rate return, etc. – it was as if the state borrowed the money at 8.25% (the average expected annual yield on the fund.)
I suspect that I’m not alone in believing it unwise to structure our state’s financial recovery around an assumption that our leaders will stop their “game playing.” There’s always something or other that needs to be financed; there’s always some crisis causing fiscal insufficiency. I further suspect that I’m not alone in allocating much of the blame for previous “game playing” to the unions themselves, and their muscle in electing the very candidates who’ve created this situation.
Note how Walsh doesn’t miss a step in spinning on behalf of the poverty industry, as well as his own: “We have more poverty in Rhode Island, and deal with it charitably, which matches the values of the majority of folks in our state” Clearly, he’s not willing to see Rhode Island’s welfare system as a competitor for overdrawn state and local funds. Also clearly, the NEA hasn’t found a way to elect candidates who will forgo all other instances of waste and corruption for the sake of those two.
Not only would a 401K system likely save us money amid the corruption that we must expect, but it would get that money out of the hands of the legislators whom the unions work so hard to put into office.
Justin:
As to the pension side of your post –
While some changes to the RI pension program have happened since this post, here is a MA vs RI comparison.
This post includes more on RI pensions.
Finally, this post discusses overall issues with public sector pensions with numerous links to additional posts on the subject to be found at the bottom.
Don
Justin
I just spoke to the human resources director for the state of New Hampshire who directed me to their annual report at http://www.nh.gov/hr/docs/annualreport2006.pdf . She has no idea where the 24,800 NH state employee figure for 2006 came from since it’s nowhere near the actual number of full time state employees, which is about 11,000. She claimed that their state employee numbers are consistently between 10,000 and 12,000. Their 2007 report is not ready yet.
Population / Land area (square miles) of New Hampshire: 1,314,895 / 8,968.10
Poverty rate: 6.6% (U.S. Average 12.7%)
http://quickfacts.census.gov/qfd/states/33000.html
Population / Land area (square miles) of Rhode Island: 1,067,610 / 1,044.93
Poverty rate: 11.6% (U.S. Average 12.7%) – so much for RI has more challenges because of our poverty rate (e.g., below national average education scores)!
http://quickfacts.census.gov/qfd/states/44000.html
New Hampshire’s population is about 23% greater than Rhode Island’s.
New Hampshire’s land area is over eight and one-half times larger than Rhode Island’s. This would require more personnel for maintaining roads, police patrolling over greater ranges, etc.
And New Hampshire manages to do this WITHOUT A SALES OR INCOME tax! The “chicken and egg” question(s) here are: 1) does this much lower tax burden explain New Hampshire’s greater prosperity and 2) its lower poverty rates?
Also, what is the impact of New Hampshire’s much lower rate of political corruption compared to RI?
Where do all of these comparisons get us?
I mean, if you want to move to New Hampshire, go ahead. It’s a lovely state. But far too much snow than I could tolerate.
Seriously, I think the more valid comparisons are between the public and the private sectors here in RI. For example, take the top four or five private sector for profit, and for or five not-for-profit employers and compare their salaries, benefits, pension plans, employee health ins. contributions, etc., to those available to public sector employees here in RI.
I’m not sure what those comparisons would show (although I could guess) but I think that would describe the market more accurately than using New Hampshire.
Frank, I’ve been searching high and low for those New Hampshire figures. Thank you for obtaining them directly from the state.
Part of the confusion is that the US Dept of Labor on-line figures (24,000+ public employees for the state of Rhode Island, for example) apparently include both state and local public employees.
I am not willing to altogether give up the state to state comparisons of public employee salaries and benefits as they can be useful. Brassband does have a point, however, that it is probably more valid to make the comparison within Rhode Island of public sector to private sector jobs, with education level as one of the primary equalizers.
Tom W. says, “Poverty rate: 11.6% (U.S. Average 12.7%) – so much for RI has more challenges because of our poverty rate (e.g., below national average education scores)!”
But, Tom…you are comparing RI and NH, not RI and the national average. RI’s poverty rate is 11.6%. NH’s rate is 6.6%. That’s a HUGE difference!
>>Tom W. says, “Poverty rate: 11.6% (U.S. Average 12.7%) – so much for RI has more challenges because of our poverty rate (e.g., below national average education scores)!” But, Tom…you are comparing RI and NH, not RI and the national average. RI’s poverty rate is 11.6%. NH’s rate is 6.6%. That’s a HUGE difference!
That is a difference. But note that is said “NATIONAL average” educational scores.
Rhode Island’s public school performance is ranked somewhere in the mid-to-low 30’s among the fifty states (this though our educational spending is among the top 5).
When those figures come out, the Educrats / teacher union apologists here ALWAYS declare that the reason for that is that our suburban schools are “good” but that our high level of impoverished / underprivileged children in the “urban cores” drag down the statewide score.
However, those figures that our statewide poverty rate is lower than the national average – meaning that all things being equal, our statewide public educational performance should be above average in national comparisons, not below average.
In other words, the “poverty” excuse by the RI educational establishment is complete BS – and our public schools are performing even worse than we thought.
>>But, Tom…you are comparing RI and NH, not RI and the national average. RI’s poverty rate is 11.6%. NH’s rate is 6.6%. That’s a HUGE difference! Some additional thoughts, Thomas. I have only anecdotal information, but believe that I can say with much confidence that RI’s “social benefits” are considerably higher than those of NH, and materially higher than the national average (I believe that the RIPolicyAnalysis web site may have firm data). FWIW, my anecdotal evidence includes someone who works in “social services” telling me several years ago that the “word was out among Hispanics” that RI had “great benefits” and that they were moving here in droves – and that the state purposely does not track the numbers so that no one could prove that it is occurring. So the differentials in the poverty rate are likely explicable to RI’s reputation (and actual status) as a “welfare magnet.” While the existence of social programs means that a higher poverty rate will correspond to higher public expenditures (and thus a higher tax burden), this is not a valid excuse for RI’s higher than NH / higher than US average tax burden. Rhode Island could “level the playing field” by benchmarking its “social service” benefits to be no greater than that of the surrounding states or, better yet, align them to be no greater than the federal minimums. No doubt, here come the retorts of greed and heartlessness. Oh really? Then in what states are we witnessing mass starvation, epidemics, etc.? Clearly the federal minimums are sufficient, and if they are not, they should be addressed at that level so that RI is not at unfair economic competitiveness advantage as compared to the other 49. Mr. Walsh has essentially admitted that RI has a generous welfare system with his remarks… Read more »
Tom W says, “However, those figures that our statewide poverty rate is lower than the national average – meaning that all things being equal, our statewide public educational performance should be above average in national comparisons, not below average.”
I disagree.
The US Census Current Population Survey for 2005 puts RI’s child poverty rate at 18.3%. That’s #33 in rank. (Child poverty is a better measure if you want to talk about education performance, because it’s the child’s situation that matters to his/her peformance).
The 2005 Chamber of Commerce report’s NEAP index for educational peformance puts RI in 3-way tie for #36.
Thus, in terms of state rankings, our scores are just about where our poverty level says we “ought” to be. The correlation between child poverty and scores is very high, and RI fits the pattern.
You also say, “teacher union apologists here ALWAYS declare that the reason for that is that suburban schools are “good” but that our high level of impoverished / underprivileged children in the “urban cores” drag down the statewide score.”
Our suburban school students DO perform better than our urban students. I can’t imagine thinking that poverty (and language barriers) aren’t a huge part of the reason.
Also, it is possible to make the claims I’m making without being a “teacher union apologist”. I think such labels cloud the debate, rather than illuminate it.
If you want to help resolve the low urban test scores, take the illegal alien kids that can’t speak the language out of the classrooms.
I’m a little busy, Greg, but if YOU want to do it I won’t stand in your way.
Also, to anticipate the objection that’s no doubt coming that “but even if poverty is a cause of low test scores we are spending so much that we should be able to overcome it”
The money can only overcome the poverty issue if it is being spent on kids in poverty. Compare per-pupil expenditures in RI district-by-district. They are not significantly higher in high-poverty areas.
For instance, Central Falls spends less per-pupil than, Warren-Bristol, Jamestown, South Kingston, Narragansett, Chariho, Newport, Warwick, and Johnston. It’s within a couple hundred dollars/kid of E. Greenwich, Exeter-West Greenwich, N. Kingston, Foster, Little Compton, Glocester, Middletown and W. Warwick.
>>Also, it is possible to make the claims I’m making without being a “teacher union apologist”. I think such labels cloud the debate, rather than illuminate it.
In “apologists” I was referring not to you but to teachers unions and the educrats at the RIDOE.
It appears that you make a fair point in correlating childhood poverty rates to educational performance.
What are the corresponding childhood poverty rates nationally and for NH?
I don’t know about Central Falls in particular, but my understanding is that per pupil spending is quite a bit higher in the urban systems of RI.
I suppose that this all comes full circle back to my earlier “RI as a welfare magnet” post.
Additionally, we still have the issue in RI where public schools / teachers don’t seem to “add value” – the demographics coming in the door have the same characteristics on the way out.
Also, U.S. public schools score poorly as compared to other industrialized countries – this though we’re one of the, if not the richest country in the world. So poverty rates alone do not explain the poor performance of our unionized public schools.
Tom W.-
In the 2005 survey, NH has the lowest child poverty in the nation, at 7.4%. Mass if 5th at 10.1% Mississippi is highest with 26.6%. The US average was 17.8%.
I’ll try to work out the average and urban/non-urban rates from the RIDE report. I think urbans are not substantially higher. What IS higher is the % of the funding that comes from state, rather than local, funds. That’s one thing that seems to rile people.
I don’t know how the formatting is going to work out, but here are the per-pupil expenditures of the state’s school districts for 2005, from RIDE/Information Works. The mean is $11,554 and the median is $11,482.
I guess we could quibble about what is urban and what is not, but I think that, overall, the urban districts’ expenditures are not, on average, significantly higher than the average of the others. If you count Providence, Central Falls, Woonsocket, Pawtucket and Newport as the only urbans, their average is $11,911 and the rest average $11,496. The difference is $415.
New Shoreham $19,954
Narragansett $14,918
Newport $14,559
Bristol-Warren $14,292
Jamestown $12,922
Providence $12,658
Johnston $12,559
Chariho $12,345
Warwick $12,205
S Kingston $12,113
Central Falls $11,979
West Warwick $11,967
Middletown $11,837
Glocester $11,683
Exeter- W. G $11,667
Little Compton $11,610
Foster $11,584
N. Kingston $11,482
E. Greenwhich $11,474
Westerly $11,241
N. Providence $10,945
E. Providence $10,923
Cranston $10,628
Lincoln $10,467
Burrilville $10,391
Woonsocket $10,232
Pawtucket $10,127
Foster-Gocester $10,077
Tiverton $9,956
Barrington $9,864
Coventry $9,827
Smithfield $9,734
Scituate $9,705
N. Smithfield $9,676
Portsmouth $9,625
Cumberland $8,709
Thomas,
IMHO you continue to make the mistake of assuming that spending more on education will improve student performance (in this case in the lower socioeconomic groups). There simply is no evidence that this is true. Now if you could raise entire neighborhoods out of poverty, and throw in responsible parenting to boot, you’ve got a legitimate shot at raising performance in these schools, but it’s not going to happen by throwing more money at the schools. I find it odd that with all that you seem to know about education and taxes that you continue to advocate for higher education spending as a solution to RIs poorly performing education system.
Frank makes a valid point.
I think that Thomas does too, to some extent.
We get into a “chicken and egg” situation – the existence of “social programs” and “English as a second language” inherently results in education EXPENDITURES being higher in lower income areas. That said, 40-plus years of the “War on Poverty” leads to the inevitable conclusion that those programs not only don’t accomplish anything, they’ve made the poverty an even worse problem. And the superior performance of Catholic schools / private schools, even in urban areas, gives lie to the notion that more money is the answer.
The per pupil figures are a mixed bag. Providence and Newport are certainly up there in spending, while the “premier” systems of East Greenwich, Barrington and Portsmouth are relatively low.
As to the “urban” districts, I also wonder what the effect is of their high dropout rate. I suspect that it costs more to educate high school students than elementary, simply because of the greater range of course offerings and more specialized teachers.
So the dropout rate might result in disproportionate “savings” to the urban districts, which may be costing us substantially more for educating children of comparable grade levels.
Epidemic of Ignorance
http://article.nationalreview.com/?q=MjYxMGYwMTgzMmRjM2ZmYjY3YzM3NjExNzQyZDdjNWE=
Frank (and SusanD),
While it is ultimately not relevant to RI, this quest to prove state employment in NH is some mythically low number illustrates the barriers to having an meaningful dialogue about the much more important underlying issues. In other words, if you post a link to a report, you should expect that people will look at it. The report and information provided by the person you spoke to in NH left out higher education, and probably other things as well.
While it is possible that the good citizens of NH are lying to the census bureau and the bureau of labor statistics about working for the state (and I did differentiate between state and local government employment, by the way), I will stick with the comparative statistics from those sources.
Bob,
In the context of a RI tax policy/state spending discussion I feel comparisons to another small New England state is relevant to RIs situation. If you do not agree with this then I imagine you wouldn’t agree that ANY comparisons of any kind would be helpful in any discussion.
If NH seems to have mythically low numbers its only because we live in RI. In a better run state NHs numbers might be typical, maybe even high. What we do know is that NH is has a viable state government, has lower taxes where one has greater freedom to spend one’s own money as they wish, in essence it seems to be a more livable, less corrupt state.
I have to chuckle at your suggestion that the folks in NH may be lying to the census bureau, claiming that they are state workers when they really aren’t. Yea, I’m sure that’s what happening.
While it is ultimately not relevant to RI, this quest to prove state employment in NH is some mythically low number illustrates the barriers to having an meaningful dialogue about the much more important underlying issues.
Posted by Bob Walsh
XXX
You overestimate people’s stupidity. NH, with 250,000 more people, spends roughly 5 billion a year while RI spends roughly 8 billion, with 20% fewer people. That’s double per capita.
NH has “zero” income tax and “zero” sales tax while RI has mid-range income tax and the highest sales tax in America. Plus $250 million from slot machines NH doesn’t have.
CASE CLOSED.
Typical union boilerplate. “Your {example, study, data, report} isn’t relevant to the discussion. But OUR data is and it says everything is fine here.”