Poverty Rate Versus Continuous Tax Burden
I’ve received several e-mails about possible distortions that can arise from plotting a true continuous variable (the relative poverty rate) versus an ordinal rank, and if it’s possible to re-plot the data against the data used to create the ranks. Of concern is that ranks can have different meanings at different points on a scale; the difference between slots 1 and 2 might be much larger and much more significant, for instance, than the difference between slots 20 and 30.
Fortunately, with the data available on the Tax Foundation website, I can express the yearly tax-burden of Rhode Island residents using the same method applied to the poverty rate, in terms of a percentage of the national average. The correlation is as strong as in the continuous-versus-rank plot…
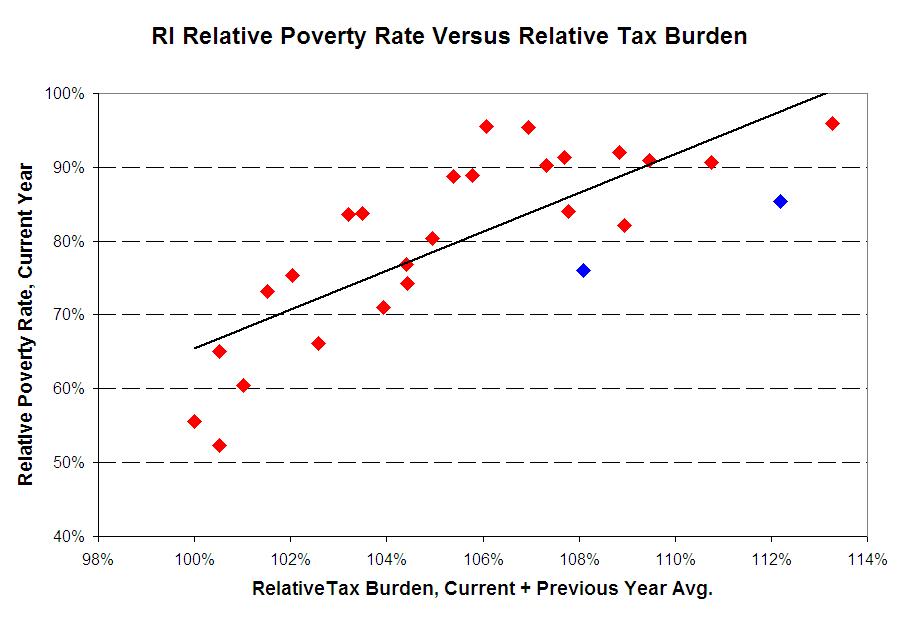
(Tax burden numbers are from the Tax Foundation, poverty numbers are from the U.S. Census Bureau)…
| Year | RI Tax Burden | US Tax Burden | RI Relative Tax Burden | RI Relative Poverty Rate |
| 1980 | 9.7% | 9.5% | 102.1% | 82.3% |
| 1981 | 9.7% | 9.3% | 104.3% | 83.6% |
| 1982 | 9.9% | 9.3% | 106.5% | 88.7% |
| 1983 | 10.1% | 9.4% | 107.4% | 95.4% |
| 1984 | 10.1% | 9.7% | 104.1% | 88.9% |
| 1985 | 9.8% | 9.7% | 101.0% | 66.2% |
| 1986 | 9.7% | 9.7% | 100.0% | 65.0% |
| 1987 | 10.1% | 9.9% | 102.0% | 60.4% |
| 1988 | 10.0% | 9.8% | 102.0% | 75.4% |
| 1989 | 9.7% | 9.8% | 99.0% | 52.3% |
| 1990 | 10.0% | 9.9% | 101.0% | 55.6% |
| 1991 | 10.1% | 9.9% | 102.0% | 73.2% |
| 1992 | 10.6% | 10.1% | 105.0% | 83.8% |
| 1993 | 10.6% | 10.2% | 103.9% | 74.2% |
| 1994 | 10.6% | 10.2% | 103.9% | 71.0% |
| 1995 | 10.7% | 10.2% | 104.9% | 76.8% |
| 1996 | 10.5% | 10.0% | 105.0% | 80.3% |
| 1997 | 10.5% | 9.8% | 107.1% | 95.5% |
| 1998 | 10.5% | 9.7% | 108.2% | 91.3% |
| 1999 | 10.3% | 9.6% | 107.3% | 84.0% |
| 2000 | 10.2% | 9.5% | 107.4% | 90.3% |
| 2001 | 10.5% | 9.5% | 110.5% | 82.1% |
| 2002 | 10.3% | 9.5% | 108.4% | 90.9% |
| 2003 | 10.6% | 9.7% | 109.3% | 92.0% |
| 2004 | 11.0% | 9.8% | 112.2% | 90.6% |
| 2005 | 11.2% | 9.8% | 114.3% | 96.0% |
| 2006 | 10.9% | 9.9% | 110.1% | 85.4% |
| 2007 | 10.5% | 9.9% | 106.1% | 76.0% |
| 2008 | 10.2% | 9.7% | 105.2% |
Interesting. I would also ask, however, why you are using relative poverty and tax rates? Those depend not only on changes in RI, but changes elsewhere. (RI’s relative poverty rate goes down if Texas’ actually poverty rate goes up). I suspect that at least some of the relationship here is an artifact of these relative measures.
What happens when you plot the actual RI poverty rate against the lagged (or two-year average) RI tax rate? Isn’t this what you’re really interested in?
The relative indicators are to help disentangle what a state is actually doing for itself, versus what’s happening because of national or international-factors beyond state government’s control. It’s hard to believe that the 10.2% poverty rate in RI at the height of the internet boom in 2000 (US poverty rate: 11.3%) has the same implications as the 10.3% rate in RI in 1994, when the US poverty rate was 14.5%. What was or wasn’t RI doing to improve its situation around 2000, compared to 1994?
The relative numbers are also a cost-of-living/regional economic adjustment. Just making some numbers up, suppose taxes in RI in year 1 were 105% of the national average, while poverty was 70% of the national average. Then, over years 2, 3, and 4, the numbers averaged out to taxes at 108% of the national average and poverty at 50%. Maybe you have a good policy in that case – even though, compared to most other states, you didn’t have much of a problem to begin with, while you raised taxes that were already “high”.
We’re not asking government to build perfection here, just to not make things worse than they were before.
Answer:
Rhode Island raised the minimum wage
Higher wages=less poverty
States that have the,much lower Federal minimum wage have the highest poverty rates
Low Minimum wage=more poverty
Leo, can you show some data for your hypothesis? First of all, the minimum wage is not a living wage and was not intended to be. Further, as the minimum wage went up in this state, so did the cost of living – especially housing. I would bet the cost of living outpaced the increase in the minimum wage and, therefore, the increase in the minimum wage was not a factor in the decrease in poverty.
If you’ve got data and analysis that demonstrates otherwise, bring it forward.
Andrew, I agree with your impulse to try to factor out the effects of global influences on RI poverty rates to determine the relation of tax and poverty rates, but a) I don’t think that can be done with just one data transformation, b) I don’t think it can be done with any 2-variable scattergram and c) I’m pretty sure what you’ve done doesn’t accomplish it. On the last point, try this for a check: If your approach succeeds in “controlling for” those global effects, you should find that the “RI relative poverty rate” is not correlated with the US poverty rate. If they are correlated, global effects still contaminate your measure. A quick pass through the data makes it appear that this is the case, because there is in fact a strong positive correlation between the two variables. I think you can verify this with a graphic, though a simple regression makes it clearer. I’m not stating this more emphatically because I’m not sure your poverty data is the same as mine. I used the data at the link below, but I doubt it makes a difference. http://www.census.gov/hhes/www/poverty/histpov/hstpov21.html …. As I say above, your measure means that, even if the RI tax-to-poverty relation stays the same over time, your measure will cause it to appear to change if poverty levels or tax rates change in other states. That obviously makes it impossible to make statements about the RI relation. In short, it is just not possible to draw the conclusion you want to from this 2-variable analysis. There’s more to be said…for instance that I don’t agree at all that your “relative tax” measure makes sense, that it’s not clear whether your poverty rates are “before transfer” or “after transfer”, that it matters more how tax dollars are spent… Read more »
Thomas, You use the term “empirical”, yet the approach you are taking towards a correlation between variables normed to national averages that is stronger than a correlation between absolute variables is that you a-priori don’t like the normed variables, so let’s ignore them. That’s not an “empirical” approach. The statement that it is “impossible” to make statements about RI involving relative variables is dubious at best. This correlations present in this and the previous post exist. Unless someone is claiming that they are either a total coincidence, or that poverty rate relative to the national average and tax burden relative to the national average are basically the same quantity, they are just as worthy of explanation as any other correlations of the same strength. Mobility is an active part of the debate about RI’s taxation and poverty policies. Various hypotheses have been advanced that people seeking benefits will [or won’t] move to places with more generous welfare policies, or that people will [or won’t] move away from places with high taxes, relative to places with lower ones. Relative measures are valid — even necessary — to describe the environment that motivates and supports such movement. More technically, I’ve made no claims of monocausality, nor that I expect RI’s tax burden statistics by themselves to explain 100% of the variation in RI’s poverty rates. When looking through multiple dependent variables (one choice being tax-burden) to explain the variation of an independent one, one general procedure is to begin with a variable that independently correlates well, then adding others. The fact that adding additional terms to a multiple regression’s first term doesn’t mean that that the first term correlation doesn’t exit or isn’t meaningful. Nor does the fact that there may be latent variables that better explain a causal relation between two… Read more »
Andrew, Here’s a response. .Your statements are in italics “You use the term “empirical”, yet the approach you are taking towards a correlation between variables normed to national averages that is stronger than a correlation between absolute variables is that you a-priori don’t like the normed variables, so let’s ignore them. That’s not an “empirical” approach.” Andrew, I’m sorry to say it, but the above statement is complete nonsense. I used the data to look at the correlation between the US poverty rate and the “RI relative poverty rate” . It is positive, fairly strong, and statistically significant. That correlation indicates that you have NOT successfully removed the effect of global influences on the RI poverty rate. I may be right and I may be wrong, but the conclusion is based on data, so In what way is that conclusion “a priori” and “not empirical”? This correlations present in this and the previous post exist. Yes, the correlations exist, but that doesn’t necessarily tell us much, if anything. There’s an (apocryphal?) story in the stats literature about a researcher who found a strong positive correlation between teacher salaries and champagne sales, and concluded that giving teachers raises was a waste because they would only spend it on booze. The correlation did in fact exist, but the conclusion was obviously nonsense. Once you control for the rise in real wages across all professions, there turns out to be no separate effect for teachers. Higher wages overall lead to higher teacher salaries and higher wages overall create more disposible income and higher liquor sales. There are a lot of zero-order correlations like this that disappear, or even reverse sign (go from positive to negative or the reverse), when you properly control for other variables. Relative measures are valid — even necessary —… Read more »
This may not be necessary, but I feel compelled to point out that the paragraph above that begins “OK,; but now try this…” contains a lot of italicized text that is NOT Andrew’s words, but my own.
Thomas, earlier in this thread, you offered some friendly advice. Allow me to return the favor. Before suggesting that quantitative results shouldn’t be presented unless they have full academic rigor, you have to at least do the courtesy of reading the actual arguments being made. You said… Your causal story is that high (relative) tax rates “cause” (are positively associated with) high (relative) poverty rates. Your evidence is that high (relative) tax rates precede high (relative) poverty rates (in your model, a high relative tax rate in year Y-1 is associated with a high poverty rate in year Y), But that’s not accurate. The argument made was… Obviously, there is more than one cause in play creating a result like this, but it is pretty clear from the most recent 25 years of Rhode Island history that creating of a high-tax state is not a great method for attacking the problem of poverty. …which is not the statement that high taxes cause poverty. Consider the actual argument, while also considering the importance of the effects of autoregression you mentioned in your previous comment. The relative poverty rate goes through several jump processes over the last 25-years of RI history. Whether or not they reflect a full statistical theory of independence between state and national causes, the jumps are visible in the data, and to be honest, I don’t really understand your argument that they don’t count because they are ratios. Anyway, back to the data itself. In 1985, after several consecutive years where poverty in RI was above 80% of the national rate it dropped below 70% for six of the next seven years. During those seven years, the RI tax burden was 102% or less of the nationwide average. I’m not really sure what was happening in RI in… Read more »