Hold Up on Making Assumptions from 85% of the Popular Vote
There is a Presidential popular vote chart getting a lot of attention out there that seems to show a big drop in Democratic votes from 2020 to 2024.
However, as pointed out by Dan McLaughlin, I think people are getting over their skis before all of the data is in. I thought a picture showing the projected ballpark final results would help.
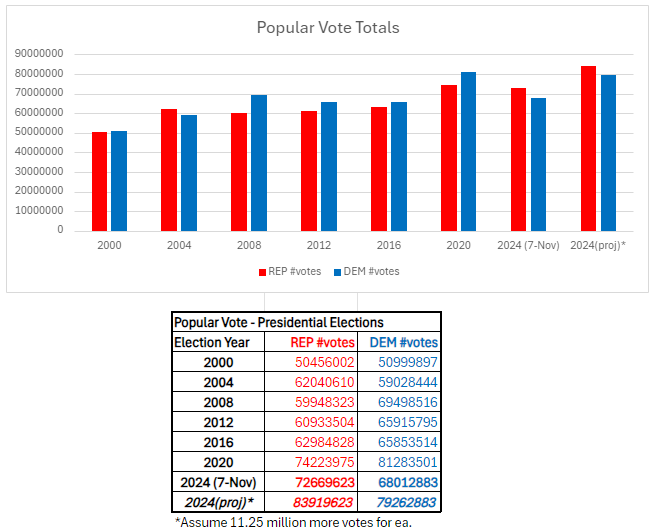
Below was created using Wikipedia popular vote totals for 2000-2020. For 2024 vote data, I took current totals from Bing search (84% reporting) this morning & projected the balance, giving each candidate 11.25 mil more votes (I assumed equal distribution, it could be a million or 2 either way, but what’s that between friends?).
Make of it what you will, I’m not a political scientist and I know it’s brute force projection and not perfect. But Harris isn’t going to end up all that far behind Biden. And Trump really improved. Harris will receive around 2 million fewer votes than Biden in ’20. Trump will receive over 2 million more than Biden in ’20 and will increase his total by nearly 10 million. Harris didn’t turn out as many voters as Biden, Trump had a great turnout op – finding unlikely voters and bringing them in and flipping some former Biden voters.
Featured image by Justin Katz using Adobe Firefly.


