The Difference a Day Makes
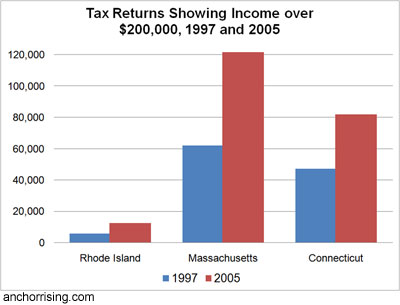
In attempting to match the Crowley/Poverty Institute/ITEP argument, I didn’t include 2005 data (in part, ahem, because its availability didn’t register in my whirlwind round of data collection). I’ve modified the charts in the previous post so that the scales match. The thing to note is how much more the columns grew for Massachusetts and Connecticut, even though it remains the case that this category of taxpayers increased “at a greater rate” in Rhode Island.
The same is true, here:
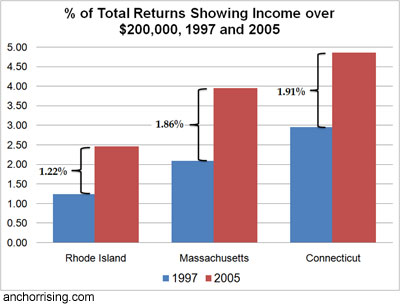
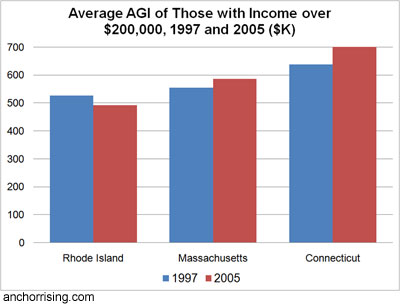
And when it comes to average adjusted gross income, Rhode Island compares even less favorably, now:
The reason that I returned to this information so soon was that commenter Chalkdust stated in the related comment thread that it is misleading of me “because it makes it appear as though the proportion or Rhode Islanders earning more than $200K is increasing at a slower rate than MA or CT, when the opposite is true.” I argued that it’s easier to almost double 1% than 2% and that wealthy people don’t grow like spores; they’re made (if only self-made) or imported. The race, if we want to see it as such, is more a matter of increments, and if MA starts one step ahead of RI and, over a period of time, takes one and a half steps, while RI takes less than one step, that isn’t evidence that RI is moving more quickly.
To illustrate the point, consider the following line chart:
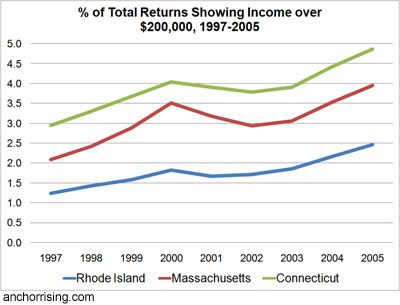
Rhode Island hardly looks as if it is catching up to its neighbors in this respect, especially when it is considered that the average AGI for this income group actually declined 6.7% from 1997 in RI, while increasing 5.6% in MA and 9.9% in CT. The combined result is that the total AGI of this group actually grew more in Massachusetts than in Rhode Island, and Connecticut wasn’t as far “behind” as it appears by other measures. (One has to laugh at the numbers game, when a state with a total AGI for the wealthy group nine-and-a-half times the size of the corresponding AGI in Rhode Island is somehow behind.)
Moreover, Rhode Island’s total tax returns increased at almost twice the rate as in Mass. and Connecticut (8.34% for RI, 4.20% for MA, and 4.99% for CT), which makes it less compelling to note that its wealthy population grew only 1.19 times that of Massachusetts and 1.57 that of Connecticut.
The real story of this round of charts, though, comes from the tax returns of those making between $75,000 and $200,000 per year:
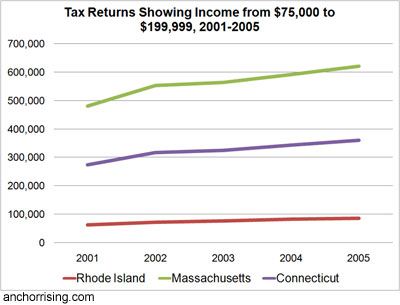
If poverty ratio trends in the 2005–2006 U.S. Census data carry through to IRS data sets, Rhode Island’s red line is about to turn south among what might be termed as the state’s productive class — 17% of the population that paid 34% of the income tax liability in 2005 and likely accounted for an even larger share of the sweat and ingenuity behind our economy.
What I would like to know is how much income the state nets on incomes over $200,000?
Shoot. I meant to include that.
I’m almost positive that it’s 41% of the total sales tax liability, but I’ll check when I get hom this evening.
Eye opening numbers.
And if it’s true that the “red line is about to turn south”, we are none too early getting spending under control.
By the way, what is Pat Crowley doing vigorously trying to defend Rhode Island’s very generous welfare benefits? Isn’t he paid by the teacher of the NEA to champion their causes?
Considering that the only people that give him any attention are RIFuture and Justin, maybe we can stop paying attention to him, leave him to his own tiny cadre of morons, and talk about other things. There’s no REASON to refute him. Nobody cares because nobody listens to him.
This site is becoming “The Pat Crowley Obsession Network”.
Three points, Greg:
1. Crowley is hardly not being heard. He’s on TV; he’s in all the papers.
2. It’s not just Crowley. As I’ve explained, he’s merely the faceman.
3. He’s a useful foil via whom to research these statistics and address what his cadre is saying. Hey, if they want him to be their most visible representative, I think we’d be mistaken not to let them.
>>By the way, what is Pat Crowley doing vigorously trying to defend Rhode Island’s very generous welfare benefits? Isn’t he paid by the teacher of the NEA to champion their causes?
Because those welfare mommas (legal and illegal alike) are not only providing the product upon which NEARI’s membership depends, they’re providing two-fers and three-fers.
Not just two-fers and three-fers because those welfare mommas typically produce multiple bastards each, but also because per capita those children produce much more revenue for NEARI than do suburban children – because they’re disproportionately “ESL / English as a second language” and “special needs” they result in the hiring of many more dues-paying school personnel than you have in the suburbs.
NEARI and welfare mommas enjoy a symbiotic relationship, both benefiting from a parasitic existence living off of the taxpayers.
Ragin’ uses the kind of language the Republican party SHOULD be using and they’d have more than 13 Reps.
Perhaps if I post Tom Sgouros’ article, he’ll join this conversation, and engage in real debate rather than the echo chamber over on that other site. Having grown up in the East Bay during the 60s, I can only laugh at his argument. Well into the 80s, Seekonk and Rehoboth were very rural — any outmigration from Providence to the suburbs that occured was (a) primarily down the west side of the bay, and (b) secondarily to the north– e.g, to Lincoln and later Smithfield and down the East Bay, primarily to Barrington (nobody in the 70s and 80s would have accused Warren of being gentrified). If you need proof, just look at the architectural history and land development records. Bottom line: Sgouros’ argument doesn’t pass the reality test for people who have lived in RI for more than 20 years. Unfortunately, that doesn’t include Matt Jerzyk and way too many members of our “progressive” community. Read it and laugh: “The story of a statistic: Where are those rich people? by: Tom Sgouros Wed Feb 06, 2008 at 15:34:44 PM EST It’s crystal clear by now that the engineers of what passes for Rhode Island’s tax policy are motivated primarily by a desire to keep rich people from moving away. In 2006, during the debate over passage of the latest tax cut for wealthy people, an interesting statistic was produced by Michael McMahon, then director of the Economic Development Corporation. He pointed out that Rhode Island had a significantly smaller percentage of taxpayers earning over $200,000 than Massachusetts: 3% to 1.9%. (Two years later, it’s now 3.9% and 2.4%.) His argument was that this proved that our state tax policy was unkind to rich people and so we had to cut their taxes and offer them back rubs. I haven’t… Read more »
First, this doesn’t account for the “rich” people who retire and go through gyrations to establish their tax residency in Florida (income tax free). There is no inherent reason why RI should not also be income-tax free, since NH does quite nicely without an income or sales tax (and has better roads, schools and economic performance than we do … far less corruption too).
Second, the whole discussion is off-base, for ideally it shouldn’t be on the radar. The fact that RI has a monumentally “progressive” income tax system (mirroring the federal one) reflects not sound economic or fiscal maximization policy. Rather, it reflects socialism under the guise of “justice” and “fairness.”
Socialism is the refuge of resentful losers and rich people (e.g., Kennedy and Whitehouse)using the middle class to fund “social programs” to buy “social peace” (and thus preserve their wealth from revolution and confiscation).
I’m late to this laugh-fest, since I don’t expect my work to be posted where I didn’t post it. I don’t mind, but I don’t know about it unless someone tells me.
But tell me, while you’re laughing at my argument, what explanation you have for the income shift in the 1960’s. Perhaps you think my attempt funny, but there is something to explain there, and state taxes don’t explain it, since they didn’t exist at the time. If you have an alternate explanation, please offer it. That’s how debate works. Ridicule is effective in a rhetorical sense, but not a forensic sense.
I’d add that in my youth in Providence, I knew several families who commuted to school or work, from Rehoboth (2), Seekonk (1) and Norton (father and son), of all places. That was in the late 1960’s and early 1970’s.
The poster about New Hampshire may be interested to read something I wrote on that subject last year. It’s on whatcheer.net, issue 21 (10/06). Were I to move to New Hampshire, my taxes would likely go up. Maybe yours, too, depending where you live now and what your profession is. The reputation is not always the same as the reality.
I’m not sure if anyone will see a reply to a stale comment thread like this, but I will see replies to the original post at rifuture.